In this topic, you will learn some basic concepts to help you debug your custom JavaScript code when you add it to Brightcove Player, and covers the following solutions:
- Get started with the basic video player code
- Display messages in the browser console
Player code
When testing and debugging your code it is most helpful to use the in-page embed player implementation (called the Advanced code in Studio). This provides the clearest way to interact with the player.
Using JavaScript is almost assuredly part of your testing and debugging, so you will want to setup your code to
use JavaScript. This is done in a standard way using the ready event. Both the in-page
embed implementation code and the ready event are shown here.
- Lines 11-18: Standard in-page embed player code
- Lines 20-24: Standard script block in which to use JavaScript
- Lines 11, 21: Player
idadded and used. This is an addition to the standard in-page embed implementation code.
<!DOCTYPE html>
<html>

<head>
    <meta http-equiv="Content-Type" content="text/html; charset=utf-8" />
    <title></title>
</head>

<body>
    <h1>Sample Player</h1>
    <video-js id="myPlayerID"
    style="width: 640px; height: 360px;"
    data-video-id="4845798282001"
    data-account="1752604059001"
    data-player="default"
    data-embed="default"
    class="video-js" controls></video-js>
    <script src="//players.brightcove.net/1752604059001/default_default/index.min.js"></script><script>
        videojs.getPlayer('myPlayerID').ready(function() {
            var myPlayer = this;
            console.log('EVENT: Player ready');
            myPlayer.on('loadedmetadata', function(evt) {
                console.log('EVENT: Metadata loaded');
            });
        });
    </script>
</body>

</html>
Displaying messages
When testing and debugging your code, it is helpful to print out text strings and object values. You can do this
using the console object. Although this object is not part of the JavaScript language,
it is part of the runtime environment and is available in most current browsers. In Firefox, it comes with the
Firebug extension. In WebKit browsers (Safari and Chrome), it is part of the Web Inspector/DevTools. In Internet
Explorer, starting with IE 11, it is part of the Developer Tools.
The console object has several methods, including:
- The
log()method for general output of logging information. This allows string substitution and additional arguments.console.log("test",1,{},[1,2,3]); - The
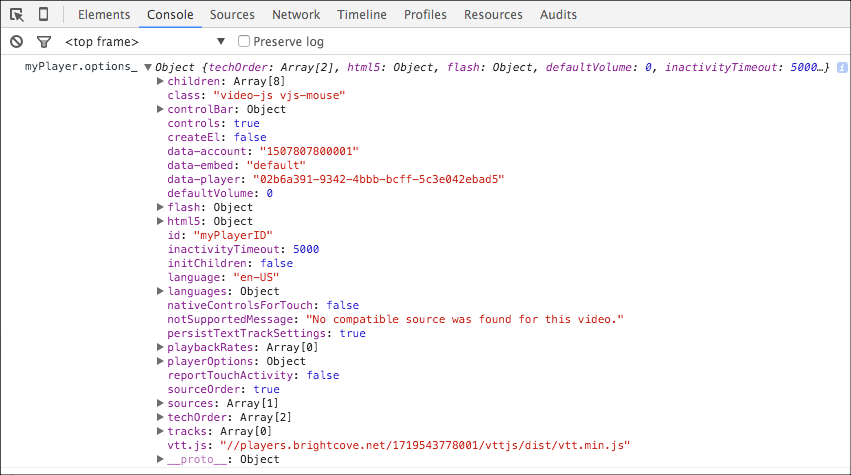
dir()method for displaying an interactive list of object properties.console.dir({one:1, two: {three:3}});
Here is example code and a screenshot of the console displaying the console.log() of
messages.
<video-js id="myPlayerID"
style="width: 640px; height: 360px;"
data-video-id="4845798282001"
data-account="1752604059001"
data-player="default"
data-embed="default"
class="video-js" controls></video-js>
<script src="//players.brightcove.net/1752604059001/default_default/index.min.js"></script><script>
    videojs.getPlayer('myPlayerID').ready(function() {
        var myPlayer = this;
        console.log('EVENT: Player ready');
        myPlayer.on('loadedmetadata', function(evt) {
            console.log('EVENT: Metadata loaded');
        });
    });
</script>
Below are details on using the console object in each browser.
Chrome
Viewing your messages in the Chrome browser
Run the sample code in the Chrome browser. To view your messages, open the DevTools panel:
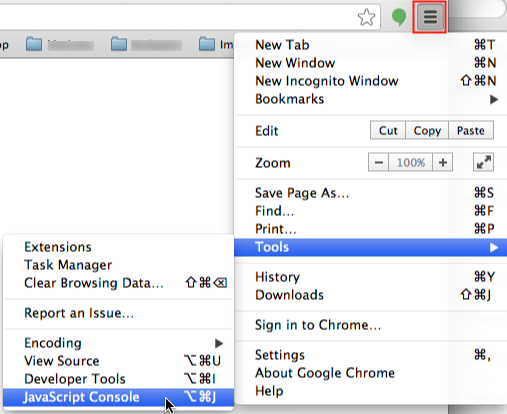
- In the Chrome browser, select the Customize and control Google Chrome icon.
- Select Tools > JavaScript Console.
Chrome Developer tools - In the DevTools panel, with the Console menu item selected, you should see your console
messages displayed here.
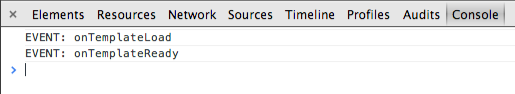
Chrome Console
View details about using Chrome DevTools.
Safari
Viewing your messages in the Safari browser
Run the sample code in the Safari browser. To view your messages, open the Developer Tools panel:
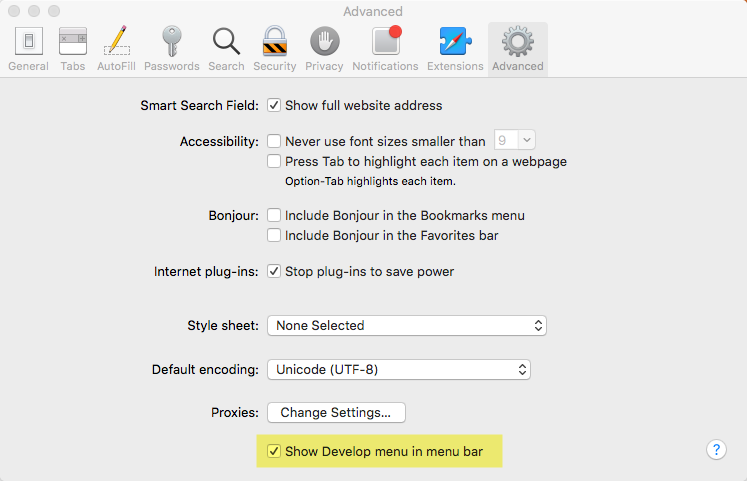
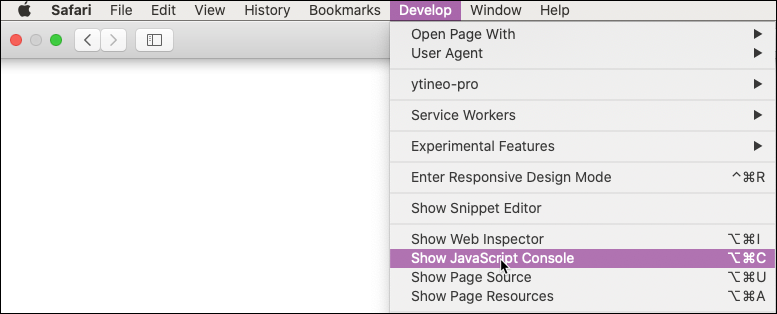
- If you don't see the Develop menu item in the Safari menu bar, follow these steps:
- Select Safari > Preferences > Advanced.
- Select the Show Develop menu in menu bar option.
Safari Develop Menu - In the Safari menu bar, select Develop > Show JavaScript Console.
Safari Error Console - In the Error Console panel, you should see your console messages displayed.
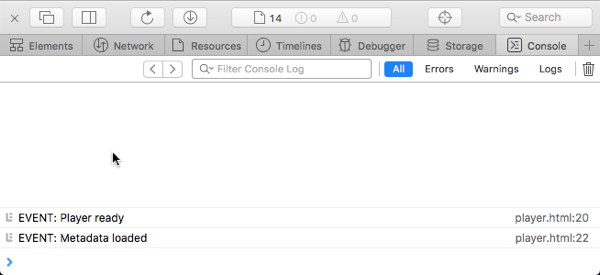
Safari Console Messages
View details about using the Safari Web Inspector.
Firefox
Viewing your messages in the Firefox browser
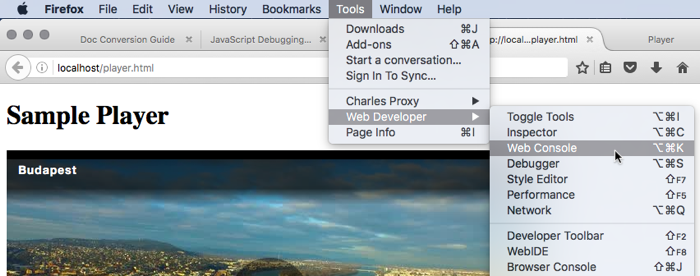
Run the sample code in the Firefox browser. To view your messages, open the Web Console panel:
- In the Firefox menu bar, select Tools > Web Developer > Web
Console.
Firefox Web Console - In the Web Console panel, you should see your console messages displayed.
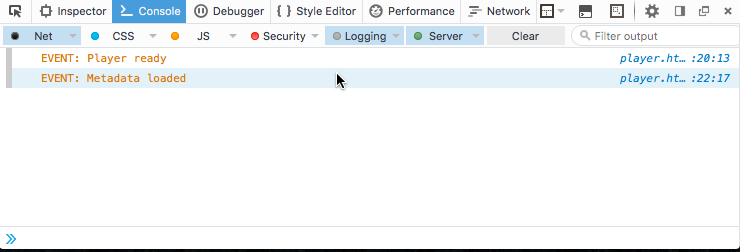
Firefox Console Messages